
Performance

Featured articles
-
![]()
Four ways we help trim your tax bill
And why these "invisible" wins matter more than you may think.
Four ways we help trim your tax bill And why these "invisible" wins matter more than you may think. As investors, we tend to focus most on what we can see. Things like portfolio makeup, and the returns generated by those investments. No less important, however, are the less obvious things, like the taxes you never paid in the first place because of technology that quietly runs in the background. You may only think about taxes once a year, but here at Betterment, every day is Tax Day. This sort of year-round tax optimization sounds boring, but believe us, it makes a difference. Taxes can steadily eat away at your returns over the years. So any advisor worth their salt should take taxes seriously and minimize them as much as possible. These “invisible” wins are hard to spot in the moment, so let’s shine a light on them now. Here are four sophisticated ways we buy, sell, and hold your shares, all in the name of trimming your tax bill. Choosing which assets go where – Our Tax Coordination feature helps shield high-growth assets in the most tax-efficient account types. Rebalancing wisely – We take advantage of any existing cash flows to help minimize capital gains taxes while rebalancing your portfolio. Choosing which taxable shares to sell (or donate) – Our TaxMin technology helps minimize short-term capital gains taxes. Harvesting losses – When your taxable investments dip below their initial purchase price, we jump on the opportunity to “harvest” the theoretical loss and potentially lower your future tax bill. 1. Choosing which assets go where From a tax perspective, you have three main account types at your disposal when saving for retirement: Tax-deferred (traditional IRAs, 401(k)s, etc.), where taxes are paid later. Tax-exempt (Roth IRAs, 401(k)s, etc.), where taxes are paid now. Taxable, where taxes are paid both now and later. Because of their different tax treatments, certain types of investments are a better fit for certain accounts. Interest from bonds, for example, is typically taxed at a higher rate than stocks, so it often makes sense to keep them away from taxable accounts. This sorting of asset types based on tax treatments, rather than divvying them up equally across accounts, is known as asset location. And our fully-automated, mathematically-rigorous spin on it is called Tax Coordination. When Tax Coordination is turned on, the net effect is more of your portfolio's growth is shielded in a Roth account, the pot of money you crucially don't pay taxes on when withdrawing funds. To learn more about our Tax Coordination feature and whether it’s right for you, take a peek at its disclosure. 2. Rebalancing wisely When the weights of asset classes in your portfolio drift too far from their targets, our technology automatically brings them back into balance. But there's more than one way to accomplish this portfolio rebalancing. You can simply sell some of the assets that are overweight, and buy the ones that are underweight (aka "sell/buy" rebalancing), but that can realize capital gains and result in more taxes owed. So we first take advantage of any available cash flows coming into or out of your portfolio. When you make a withdrawal, for example, we intentionally liquidate overweight assets while striving to minimize your tax hit as much as possible (more on that below). And when you deposit money or receive dividends, we use those funds to beef up underweight assets. 3. Choosing which taxable shares to sell (or donate) Say there's no way around it: you need to sell an asset. Maybe cash flows aren't enough to keep your portfolio completely balanced. Or you’re withdrawing funds for a major purchase. The question then becomes: which specific assets should be sold? The IRS and many brokers follow the simple script of "first in, first out," meaning your oldest assets are sold first. This approach is easier for your broker, and it can avoid more highly-taxed short-term capital gains. But it often misses the opportunity of selling assets at a loss, and harvesting those losses for potential tax benefits. So our algorithms take a more nuanced approach to selecting shares, and we call this technology TaxMin. TaxMin is calibrated to avoid frequent small rebalance transactions and seek tax-efficient outcomes, things like helping reduce wash sales and minimizing short-term capital gains. In the case of donating shares, we apply the same logic in reverse, or TaxMax as we call it. That's because when donating shares, it benefits you to choose the ones with the most gains, since any shares bought as a replacement will effectively have a reset tax bill. 4. Harvesting losses Life is full of ups and downs, and your investments are no different. At times, most notably during market downturns, the price of an asset may dip below what you paid for it. Tax loss harvesting takes advantage of these moments, selling taxable assets that fit this bill, then replacing them with similar ones so you stay invested. You can then use those harvested losses to shift taxes you owe now into the future. The strategy doesn’t make sense for everyone, but it can help some investors sprinkle tax advantages on a portion of their taxable investing. And our fully-automated spin on it takes a tax hack once reserved for the wealthy and makes it available to the masses. Happy harvesting. In conclusion, we care a lot about taxes Because it’s one of the most reliable ways to boost your returns. We can’t control the market, but tax laws? Those are set by the IRS and broadcast far and wide. And we can help you navigate them wisely. We wouldn’t be doing our job if we didn’t. So the next time you take a peek at your returns, ask yourself how much of that growth will still be there come tax time. If you’re a Betterment customer, you can rest assured we’re working tirelessly to minimize those tax drags. You may not realize it right away, and rightfully so. Live your life, and leave the tax toiling to us. -
![]()
How socially responsible investing connects your holdings to your heart
Learn more about this increasingly-popular category of investing.
How socially responsible investing connects your holdings to your heart Learn more about this increasingly-popular category of investing. Socially responsible investing (SRI), also known as environmental, social, and governance (ESG) investing, screens for companies that consider both their returns and their responsibility to the wider world. It’s a growing market for investors, with assets totaling $30 trillion as of 2022. We launched our first SRI portfolio back in 2017, and have since expanded to a lineup of three options: Broad Impact Social Impact Climate Impact All three are globally-diversified, low-cost, and built to help align your investing with your values. So let’s explore a few ways they do that, before tackling a common question about the SRI category in general: performance. How our Social Impact portfolio lifts up underserved groups Social Impact uses the Broad Impact portfolio’s foundation while adding a trio of funds focused on helping underserved groups get on equal footing. There’s $SHE and $JUST, which screen for U.S. companies demonstrating a commitment toward gender and social equality, respectively. Then there’s $VETZ, our latest addition to the portfolio. $VETZ is the first of its kind: a publicly-traded ETF that mainly invests in loans to active and retired U.S. service members, and the survivors of fallen veterans. These types of home and small-business loans have historically helped diversify portfolios, and they also help lower borrowing costs for veterans and their families. And unlike $SHE and $JUST, which are comprised of stocks, $VETZ is an all-bond fund. So even if you have a lower appetite for risk when investing, your SRI portfolio can maintain an exposure to socially responsible ETFs. How the $VOTE fund is shaking up shareholder activism Remember the “G” in ESG? It stands for governance, or how companies go about their business. Do they open up their books when necessary? Is their leadership diverse? Are they accountable to shareholders? On that last front, there’s the $VOTE ETF found in each one of our SRI portfolios. On the surface, it seems like a garden variety index fund tracking the S&P 500. Behind the scenes, however, it’s working to push companies toward positive environmental and social practices. It does this by way of “proxy” voting, or voting on behalf of the people who buy into the fund. Engine No. 1, the investment firm that manages $VOTE, puts these proxy votes to use during companies’ annual shareholder meetings, where individual shareholders, or the funds that represent them, vote on decisions like board members and corporate goals. In 2021, Engine No. 1 stunned the corporate world by persuading a majority of ExxonMobile shareholders to vote for three new board members in the name of lowering the company’s carbon footprint. And it did all this in spite of holding just .02% of the company’s shares itself. Not a bad return on investment, huh? Does SRI sacrifice gains in the name of good? We now stand eye-to-eye with the elephant in the room: performance. Worrying about returns is common regardless of your portfolio, so it’s only natural to question how socially responsible investing in general stacks up against the alternatives. Well, the evidence points to SRI comparing quite well. According to a survey of 1,141 peer-reviewed papers and other similar meta-reviews: The performance of SRI funds has “on average been indistinguishable from conventional investing.” And while the researchers note that it’s “likely that these propositions will evolve,” they also found evidence that SRI funds may offer “downside” protection in times of social or economic crisis such as pandemics. Your socially responsible investing, in other words, is anything but a charity case. Simplifying the socially responsible space Not long ago, SRI was barely a blip on the radar of everyday investors. If you were hip to it, you likely had just two options: DIY the research and purchase of individual SRI stocks Pay a premium to buy into one of the few funds out there at the time Those days are thankfully in the past, because our portfolios make it easy to express your values through your investing. And our team of investing experts regularly seeks out new funds like $VETZ and updated SRI standards that strive to deliver more impact while helping you reach your goals. Check out our full methodology if you’re hungry for more details. And if you’re ready to invest for a better world, we’ve got you covered. -
![]()
With U.S. markets struggling, is now the time to go global?
Here’s the case for keeping a little international exposure in your investing.
With U.S. markets struggling, is now the time to go global? Here’s the case for keeping a little international exposure in your investing. U.S. stocks have been the envy of the world since 2010, generating nearly 4 times the returns of their international counterparts. But since April 2, President Trump’s tariff policies have dragged down U.S. stocks and left investors unnerved. Does this mean the U.S. market is toast? Certainly not, but it does signal a potential shift in foreign investment, which means that if you haven’t already, now may be the time to consider diversifying globally. And we can help on that front. Hello, world. We're here to invest. The U.S. market is big, but it’s not the only game in town. Hundreds of billions of dollars in assets trade hands in international markets each day. It's why the Betterment Core portfolio, built on the idea that more diversification equals less risk, roughly mirrors the relative weights of global markets. Like we mentioned above, the U.S. market has been on an absolute tear the past 15 years, and even more so since 2020. This record winning streak has fueled our home bias, or the tendency for American investors to favor American markets. But history shows a pendulum that typically swings back and forth every 5 to 10 years. International markets outperformed in the 2000s, for example, and they saw a huge spike in the late 80s. So what’s an investor to do? If you're investing for the long term, the odds are good the U.S. market will hit at least one extended rough patch in that time. And in that scenario, a globally-hedged portfolio will very likely smooth out your returns from year to year. We’re seeing this start to play out in 2025, with the Betterment Core portfolio and its global diversification outperforming many common U.S.-only funds. As of 5/2/2025. Betterment Core composite actual time-weighted returns: 10.52% over 1 year, 12.35% over 5 years, and 7.30% over 10 years as of 5/2/2025. Composite performance calculated based on the dollar weighted average of actual client time-weighted returns for the Core portfolio at 90/10 allocation, net fees. Performance not guaranteed, investing involves risk. That being said, diversification is a sliding scale. There is no pass/fail, no good or bad. If you’re looking for a little more international exposure, but not to the extent of one of our pre-built portfolios, you can invest in our Flexible portfolio and tailor your allocation as you see fit. But if you’re less experienced in investing, and simply want an option that requires less work, then let us do the recalibrating for you. We update our pre-built portfolios annually, finetuning our U.S. and international exposures based on the latest long-term projections. We can’t predict when the global tides will turn, but we can make sure you don’t miss out when they do.


Considering a major transfer? Get one-on-one help with one of our experts. Explore our licensed concierge
All Performance articles
-
![]()
The pitfalls of comparing portfolio returns
The pitfalls of comparing portfolio returns Jan 28, 2026 8:00:00 AM How to take stock of your stocks (and bonds)—here, there, everywhere. Investing can feel like a leap of faith. You pick a portfolio. You deposit money. Then, you wait. Trouble is, it takes a while for compound growth to do its thing. Using the Rule of 72 and historical stock returns, it takes roughly a decade for every dollar invested to double. That’s a lot of time for second-guessing. You may peek at your portfolio returns and wonder, “Could I be doing better?” Don’t worry; it’s normal to question whether we’re making the right choices with our money. But comparing different portfolios can be tricky. Variables abound. There’s the composition of the portfolios themselves, but also their fees and tax treatments. So whether you’re sizing us up with rival money managers, or with the stock indexes you see most often in the news, we’re here to help you level set. The ABCs of apples-to-apples comparisons Let’s start with a statistic we’re quite proud of: Since its launch, our Core portfolio’s average annual return has been ~10% after fees*. Those are the returns of real Betterment customers, minus fees, and taking the timing of deposits and withdrawals out of the equation. This helps focus more on the performance of the portfolio itself. *As of 12/31/2025, and inception date 9/7/2011. Composite annual time-weighted returns: 20.1% over 1 year, 9.3% over 5 years, and 10.1% over 10 years. Composite performance calculated based on the dollar-weighted average of actual client time-weighted returns for the Core portfolio at 90/10 allocation, net of fees, includes dividend reinvestment, and excludes the impact of cash flows. Performance not guaranteed, investing involves risk. So, is 10% good? Well, it depends on the comparison. Stock indexes like the S&P 500 and Dow Jones dominate the news, but they’re hardly comprehensive. For one, they exclude bonds, a lower-yield staple of many portfolios. There’s a reason why regardless of the portfolio, we recommend holding at least some bonds. They help temper market volatility and preserve precious capital. Secondly, popular indexes also largely ignore international markets. The S&P, for example, typically represents less than half the value of all investable stocks in the world. Our globally-diversified portfolios, meanwhile, spread things out in service of a smoother investing journey. We're built for the long run, and history has shown that American and International assets take turns outperforming each other every 10-15 years. So the modest amount of international exposure in many of our portfolios means this: you're in a better position to profit when the pendulum swings the other way. Now, taking all of this to heart isn't easy. Not when the S&P returns 20% in a given year. At moments like these, it’s perfectly normal to feel FOMO when looking at the returns of your globally-hedged investing. To keep the faith, it helps to keep the right benchmark(s) in mind. Not all diversification is created equal We’re not alone in offering globally-diversified portfolios. But two portfolios, even with similar stock-to-bond ratios, can take very different paths to the same end goal. Tax optimization, market timing, and fund fees can all impact your investing’s bottom line as well. Some investors compare providers by investing a little with each, waiting a few months, then comparing the balances. This sort of trialing, however, may not tell you much. When it comes to our portfolios, you can find better comparisons in two particular ETFs that seek to track a wide swath of the market: ACWI for stocks and AGG for bonds. See how your Betterment portfolio stacks up against them in the Performance section for any goal or account. Simply scroll down to “Portfolio returns,” click “Add comparison,” and pick from the available allocations of stocks and bonds. We show your “Total return” by default at Betterment, otherwise known as the portfolio’s total growth for a given time period. You can also see this expressed as an “Annualized” return, or the yearly growth rate you often see advertised with other investments. Putting your performance in perspective Comparison may be the thief of joy, but it’s okay, prudent even, to evaluate your investing returns on occasion. Once or twice a year is plenty. The key is to steer clear of common pitfalls along the way. Like comparing your globally-diversified apple to someone else’s all-U.S. orange. Or cherry-picking a small sample size instead of a longer, more-reliable track record. It’s easier said than done. That’s why we bake more relevant comparisons right into the Betterment app. It’s also why we produce content like this. Because if there’s a silver lining to the slow snowballing of compound growth, it’s that you have plenty of time to brush up on the basics. -
![]()
Save more, sweat less with recurring deposits
Save more, sweat less with recurring deposits Jan 28, 2026 5:00:00 AM How one click—and the power of dollar cost averaging—can boost your returns Healthy habits like exercising, eating well, and saving are hard for a reason. They take effort, and the results aren’t always immediate. Except in the case of saving, there’s a simple hack that lowers the amount of willpower needed: setting up recurring deposits. So kick off those running shoes, because you barely have to lift a finger to start regularly putting money into the market. $2, $200, it doesn’t matter. This one deposit setting, along with a little help from something called dollar cost averaging, can lead to better returns. Our own data shows it: Betterment customers using recurring deposits earned ~4% higher annual returns. Based on Betterment’s internal calculations for the Core portfolio over 5 years. Users in the “auto-deposit on” groups earned an additional 0.6% over the last year and 1.6% annualized over 10 years. See more in disclosures. Three big reasons they fared better than those who rarely used recurring deposits include: When you set something to happen automatically, it usually happens. It's relatively easy to skip a workout or language lesson. All you need to do is … nothing. But the beauty of recurring deposits is it takes more energy to stop your saving streak than sustain it. When you regularly invest a fixed amount of money, you're doing something called dollar cost averaging, or DCA. DCA is a sneaky smart investment strategy, because you end up buying more shares when prices are low and fewer shares when prices are high. A steady drip of deposits helps keep your portfolio balanced more cost-effectively. Instead of selling overweighted assets and triggering capital gains taxes, we use recurring deposits to regularly buy the assets needed to bring your portfolio back into balance. Now it’s time for an important caveat: The benefits of dollar cost averaging don't apply if you have a chunk of money lying around that’s ripe for investing. In this scenario, slowly depositing those dollars can actually cost you, and making a lump sum deposit may very well be in your best interest. But here’s the good news: While DCA and lump sum investing are often presented in either/or terms, you can do both! In fact, many super savers do. You can budget recurring deposits into your week-to-week finances—try scheduling them a day after your paycheck arrives so you’re less likely to spend the money. Then when you find yourself with more cash than you need on hand, be it a bonus or otherwise, you can invest that lump sum. Do both, and you may like what you see when you look at your returns down the road. -
![]()
Inside the investing kitchen, part 1
Inside the investing kitchen, part 1 Jun 24, 2025 11:30:00 AM The recipe for a better portfolio, and the science behind a safer nest egg. Jamie Lee isn’t a Top Chef, but he knows his way around the kitchen. He dabbles in sous vide with the help of a sous chef (his 6-year-old daughter). He loves smoking salmon low and slow on a pair of pellet grills. And in some ways, his day job on the Betterment Investing team resembles the culinary world as well. He and his teammates work in a test kitchen of sorts, defining and refining the recipes for our low-cost, high-performing, and globally-diversified portfolios. They size up ingredients, pair flavors, and thoughtfully assemble the courses of each “meal.” All in service of customers with varying appetites for risk. It's highly-technical work, but we wouldn't be Betterment if we didn't make our methodologies as accessible as possible. So whether you're kicking the tires on our services, or you're already a customer and simply curious about the mechanics of your money machine, come along for a three-part, behind-the-scenes look at how we cook up a better portfolio. Here in part 1, we'll explore how we allocate your investing at a high level. In part 2, we'll zoom in to our process for selecting specific funds. And in part 3, we'll show you how we handle thousands of trades each day to keep our customers’ portfolios in tip-top shape. The science behind a safer nest egg Betterment customers rely on Jamie and team to do the heavy lifting of portfolio construction. They distill handfuls of asset classes, a hundred-plus risk levels, and thousands of funds into a simple yet eclectic menu of investment options. And underpinning much of this process is something called Modern Portfolio Theory, a framework developed by the late American economist Harry Markowitz. The theory revolutionized how investors think about risk, and led to Markowitz winning the Nobel Prize in 1990. Diversification lies at the heart of Modern Portfolio Theory. The more of it your investing has, the theory goes, the less risk you're exposed to. But that barely scratches the surface. One of the meatiest parts of building a portfolio (and by extension, diversifying your investing) is how much weight to give each asset class, also known as asset allocation. Broadly speaking, you have stocks and bonds. But you can slice up the pie in several other ways. There’s large cap companies or less established ones. Government debt or the corporate variety. And even more relevant as of late: American markets or international. Jamie came of age in South Korea during the late 90s. Back here in the States, the dot-com bubble was still years away from popping. But in South Korea and Asia more broadly, a financial crisis was well underway. And it changed the trajectory of Jamie’s career. His interest in and application of math shifted from computer science to the study of markets, and ultimately led to a PhD in statistics. Jamie Lee (right) helps optimize the weights of asset classes in Betterment portfolios. For Jamie, the interplay of markets at a global level is fascinating. So it’s only fitting that when optimizing asset allocations for customers, Jamie and team start with the hypothetical "global market portfolio," an imaginary snapshot of all the investable assets in the world. The current value of U.S. stocks, for example, represents about two-thirds the value of all stocks, so it's weighted accordingly in the global market portfolio. These weights are the jumping off point for a key part of the portfolio construction process: projecting future returns. Reverse engineering expected returns “Past performance does not guarantee future results.” We include this type of language in all of our communications at Betterment, but for quantitative researchers, or “quants,” like Jamie, it’s more than a boilerplate. It’s why our forecasts for the expected returns of various asset classes largely aren't based on historical performance. They're forward-looking. "Past data is simply too unreliable," says Jamie. "Look at the biggest companies of the 90s; that list is completely different from today.” So to build our forecasts, commonly referred to in the investing world as Capital Market Assumptions, we pretend for a moment that the global market portfolio is the optimal one. Since we know roughly how each of those asset classes performs relative to one another, we can reverse engineer their expected returns. This robust math is represented by a deceivingly short equation—μ = λ Σ ωmarket—which you can read more about in our full portfolio construction methodology. From there, we simulate thousands of paths for the market, factoring in both our forecasts and those of large asset managers like BlackRock to find the optimal allocation for each path. Then we average those weights to land on a single recommendation. This “Monte Carlo" style of simulations is commonly used in environments filled with variables. Environments like, say, capital markets. The outputs are the asset allocation percentages (refreshed each year) that you see in the holdings portion of your portfolio details At this point in the journey, however, our Investing team's work is hardly finished. They still need to seek out some of the most cost-effective, and just plain effective, funds that give you the intended exposure to each relevant asset class. For this, we need to head out of the test kitchen and into the market. So don’t forget your tote bag. -
![]()
Inside the investing kitchen, part 2
Inside the investing kitchen, part 2 Jun 24, 2025 11:25:00 AM See how we source the higher-quality, lower-cost funds that fill up your portfolio. A lot goes into the making of a single Betterment portfolio. So much that we're spreading out this showcase of our Investing team's work over three parts. In part 1, we explore how we allocate customers’ investing at a high level, and in part 3, we show how we handle thousands of trades each day to keep their portfolios humming. And here in part 2, we zoom into a topic that may be a little more relatable for the everyday investor: picking the actual investments themselves. If asset allocation is like refining a recipe, then today's topic of fund selection is all about the sourcing of higher-quality, lower-cost ingredients. And for that, we turn our eye toward a market of another kind. Josh Shrair specializes in shopping capital markets here at Betterment, picking the funds that fill up your portfolio's respective allocations. His line of work looked a little different decades ago, back when his step dad was working as a trader on Wall Street. Back then, this level of attention to portfolio construction and fund selection was typically in service of only the ultra wealthy. But now, Josh and team navigate a rapidly-expanding universe of investments on behalf of everyday investors. Why shopping for funds isn't always so simple On one hand, the recent explosion of investment options has been great for investors. Increased competition drives down costs and opens up access to newer, more niche markets. But more choice also leads to more complexity. Take Exchange Traded Funds (ETFs), our preferred building block for portfolios thanks to their transparency, tax efficiency, and lower costs. They bundle up hundreds, and sometimes thousands, of individual stocks and bonds. But even ETFs are multiplying fast. In 2024 alone, 723 new ones launched, bringing the total to nearly 4,000. To illustrate this abundance, let's say your asset allocation calls for a heaping serving of “Large Cap” stocks, meaning companies valued at $10 billion or more. Nearly 500 ETFs populate this particular corner of the ETF universe. We can narrow that group down to 30 based on the specific exposure we’re looking for, like say U.S. Large Cap companies, or the S&P 500, a list or “index” of 500 of the biggest American companies. But the due diligence is hardly done. Some ETFs that track the S&P 500 follow it faithfully, while others put their own spin on it, which can open investors up to unintended exposure. Josh Shrair (second from left) helps navigate a rapidly-expanding universe of ETFs on behalf of Betterment customers. Just as crucially, their costs are all over the place, and higher fees can erode your returns in the long run. That's why the SPDR fund is currently our Core portfolio’s primary way of achieving U.S. Large Cap stock exposure. It offers both a low cost to hold (0.02%) and a low cost to trade (0.03% at the time of writing), making for a low overall cost of ownership. "Shopping for investments is a little like buying a car," Josh says. "The total cost is way more than the sticker price." How we calculate cost of ownership Part of our role as a fiduciary, someone who's legally obligated to act in their clients' best interests, is conducting a deep and unbiased evaluation of the ETFs used in our portfolios. The process Josh and team use is entirely "open architecture," meaning we’re not obligated to use funds from any particular provider. Instead, we strive to select the most optimal ones in terms of cost and exposure. It helps that Betterment itself doesn't make, manage, and sell funds, which means we avoid the inherent conflict of interest some advisors face when they also act as a fund manager. These firms can be tempted to steer customers toward their own funds, even when a better alternative exists. So we take pride in the due diligence behind our fund selection, and that begins with our "cost of ownership" scoring methodology. It factors in the two types of costs mentioned earlier: the cost to "hold" or own a fund, also known as its expense ratio, and the cost to trade it. As you'll see in part 3 of this series, a portfolio is hardly static. Deposits come in. Withdrawals go out. Rebalancing takes place on the regular. All of this requires daily trading, so the cost of those transactions matters to your investing's bottom line. The cost-to-trade is also known as the "bid-ask spread," or the markup that traders expect when selling a share. It's how they make money, and similar to wholesalers and retailers like Costco, the bigger the fund, the smaller the margins a trader can live with. Seeking out these value buys is how we're able to deliver globally-diversified portfolios at a fraction of the cost of alternatives on the market today. And we’re never done shopping. Our preferred funds are updated multiple times throughout the year. Primed for the purchase There's a lot more to our fund selection methodology, especially for funds that aren’t tied to a specific index, but are instead made from scratch. Some fund managers like Goldman Sachs, where Josh worked earlier in his career, also blend both approaches into a “smart beta” strategy. We offer one such portfolio alongside our Betterment-built collections. But for the sake of this series, let's pretend for a moment that our tote bags are full, and we're ready to check out. It’s time to meet the team behind every transaction at Betterment. -
![]()
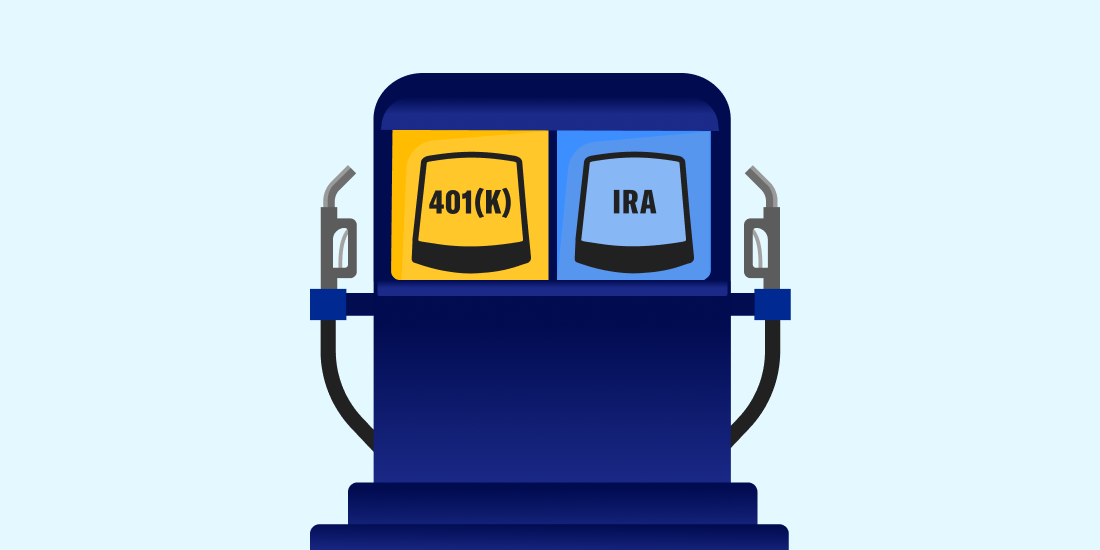
Should you fill up your 401(k) first, or your IRA?
Should you fill up your 401(k) first, or your IRA? Oct 24, 2024 11:30:19 AM Navigating one of retirement saving’s first forks in the road. Can you have both a 401(k) and an IRA? Yes! But having access to both accounts begs the question: Which one is more deserving of your retirement dollars? The answer, as it so often does in personal finance, depends on your situation. So let’s explore when a 401(k)-first mentality makes sense, and when it doesn't, before closing things out with a wildcard third option that might warrant both your attention and your savings. A quick refresher on retirement accounts For the sake of this conversation, we're focusing on the two most common retirement accounts: the IRA and the 401(k), including the non-profit/public equivalent 403(b) account. Both come with built-in tax advantages, annual contribution limits, and eligibility criteria: 401(k) Accessible to: Anyone whose employer offers one 2026 contribution limit: $24,500 (for those under 50) IRA Accessible to: Anyone whose Modified Adjusted Gross Income (MAGI) falls below the IRS's eligibility limits (see table below) qualifies for tax benefits. 2026 contribution limit: $7,500 (for those under 50) 2026 IRA income limits Traditional IRA* Modified Adjusted Gross Income (MAGI) Roth IRA Modified Adjusted Gross Income (MAGI) Full tax deduction $0-$81,000 (single filers) Full contribution $0-$153,000 (single filers) $0-$129,000 (married filing jointly) $0-$241,999 (married filing jointly) Partial tax deduction $81,001-$90,999 (single filers) Partial contribution $153,001-$167,999 (single filers) $129,001-$148,999 (married filing jointly) $242,000-$251,999 (married filing jointly) No tax deduction** $91,000 and up (single filers) No contribution $168,000 and up (single filers) $149,000 and up (married filing jointly) $252,000 and up (married filing jointly) *If covered by a retirement plan at work **Anyone is eligible to make non-deductible contributions to a traditional IRA See the income limits for more tax filing statuses Source: IRS Power ranking your retirement accounts In general, there are a few reasons why you might default to the 401(k), including but not limited to: You can contribute by way of payroll deductions and ease the sting of saving. Many employers offer matching contributions, aka free money. And you can contribute significantly more money to them than IRAs. Altogether, that's a lot of pros working in the 401(k)’s favor. But not all 401(k)s are created equal. Some providers charge more for limited investment options. According to the 24th edition of the 401k Averages Book, the average investment expense for some smaller plans1 was 1.12%. By comparison, you can invest with a Betterment IRA for an all-in fee well south of 1%. So ask your employer or 401(k) provider for help sizing up your total costs. Or take a look at your 401(k) statement for code names like: Management fees Asset-based fees Operating expenses Expense ratios If you find your 401(k) costs are significantly steeper than an IRA, consider the following order of operations: Fill up your 401(k) up to your employer’s match, assuming they offer one. Max out your IRA, assuming you’re eligible. Come back to your 401(k). On the other hand, if your 401(k)’s fees are competitive, congratulations! Things just got simpler. Consider maxing it out first before turning your attention to an IRA, or that wildcard option we mentioned earlier. A quick aside on the Health Savings Account (HSA) Sure, the name says "health," but HSAs can be repurposed for retirement savings as well. They come with a $4,400 contribution limit for individuals, and they’re available to anyone enrolled in a high-deductible health plan (HDHP). They’re also triple tax-advantaged, meaning money is tax-free going in, tax-free while it grows, and tax-free coming out, assuming it’s used for qualified expenses. That’s one more tax perk than 401(k)s and IRAs, which make you choose between either tax-deferred contributions or tax-free withdrawals. Tax-free contributions Tax-free growth Tax-free withdrawals Traditional 401(k)/IRA ✓ ✓ X Roth 401(k)/IRA X ✓ ✓ HSA ✓ ✓ ✓ So if an HDHP is right for your healthcare needs, consider prioritizing an HSA before an IRA. Between those two accounts and the 401(k), that's more than $30,000 worth of annual investing potential. Fill up those tanks, and you’ll be well on your way to retiring. Now just enjoy the ride. -
![]()
The savvy saving move for your excess cash
The savvy saving move for your excess cash Aug 6, 2024 2:37:52 PM And why taking the “lump sum” leap may be in your best interest We're living in strange financial times. Inflation has taken a huge bite out of our purchasing power, yet investors are sitting on record amounts of cash, the same cash that's worth 14% less than it was just three years ago. High interest rates explain a lot of it. Who wouldn't be tempted by a 5% yield for simply socking away their money? But interest rates change, and we very well could be coming out of a period of high rates, leaving some savers with lower yields and more cash than they know what to do with. So let's start there—how much cash do you really need? Then, what should you do with the excess? How much cash do you really need? Cash serves three main purposes: Paying the bills. The average American household, as an example, spends roughly $6,000 a month. Providing a safety net. Most advisors (including us) recommend keeping at least three months' worth of expenses in an emergency fund. Purchasing big-ticket items. Think vacations, cars, and homes. Your spending levels may differ, but for the typical American, that's $24,000 in cash, plus any more needed for major purchases. If you're more risk averse—and if you're reading this, you just might be—then by all means add more buffer. It's your money! Try a six-month emergency fund. If you’re a freelancer and your income fluctuates month-to-month, consider nine months. Beyond that, however, you're paying a premium for cash that’s not earmarked for any specific purpose, and the cost is two-fold. Your cash, as mentioned earlier, is very likely losing value each day thanks to inflation, even historically-normal levels of inflation. Then there's the opportunity cost. You're missing out on the potential gains of the market. And the historical difference in yields between cash and stocks is stark, to say the least. The MSCI World Index, as good a proxy for the global stock market as there is, has generated a 8.5% annual yield since 1988. High-yield savings accounts, on the other hand, even at today’s record highs, trail that by a solid three percentage points. So once you've identified your excess cash, and you’ve set your sights on putting it to better use, where do you go from there? What should you do with the excess? Say hello to lump sum deposits. Investing by way of a lump sum deposit can feel like a leap of faith. Like diving into the deep end rather than slowly wading into shallow waters. And it feels that way for a reason! All investing comes with risk. But when you have extra cash lying around and available to invest, diving in is more likely to produce better returns over the long term, even accounting for the possibility of short-term market volatility. Vanguard crunched the numbers and found that nearly three-fourths of the time, the scales tipped in favor of making a lump sum deposit vs. spreading things out over six months. The practice of regularly investing a fixed amount is called dollar cost averaging (DCA), and it’s designed for a different scenario altogether: investing your regular cash flow. DCA can help you start and sustain a savings habit, buy more shares of an investment when prices are low, and rebalance your portfolio more cost effectively. But in the meantime, if you’ve got excess cash, diving in with a lump sum deposit makes the most sense, mathematically-speaking. And remember it’s not an either-or proposition! Savvy savers employ both strategies—they dollar cost average their cash flow, and they invest lump sums as they appear. Because in the end, both serve the same goal of building long-term wealth.


Looking for a specific topic?
- 401(k)s
- 529s
- Asset types
- Automation
- Benchmarks
- Bonds
- Budgeting
- Compound growth
- Costs
- Diversification
- Donating shares
- ETFs
- Education savings
- Emergency funds
- Financial advisors
- Financial goals
- Flexible portfolios
- Getting started investing
- Health Savings Accounts
- Home ownership
- IRAs
- Interest rates
- Investing accounts
- Market volatility
- Mutual funds
- Performance
- Portfolios
- Preparing to retire
- Retirement income
- Retirement planning
- Risk
- Rollovers and transfers
- Roth accounts
- Stocks
- Tax Coordination
- Tax loss harvesting
- Taxable accounts
- Taxes
No results found