
Why diversify outside of the US?
Why global diversification is a core part of portfolio construction, not a reaction to recent market performance.


U.S. investors often think of the S&P 500 Index (an index of the largest companies in the U.S. by market capitalization) when referring to the performance of the stock market. This is not surprising to hear as most U.S. based investors exhibit a “home bias,” where they focus their investing domestically and less on international. According to MorningStar fund data, assets in international funds amount to only about a quarter of the amount invested in U.S. focused funds.
On top of that, U.S. stocks set a high bar for performance globally, outpacing the gains in stocks across Europe, Japan, and emerging markets from 2009 to 2024. It’s become natural to ask, “Can’t I get better returns just sticking with U.S. stocks? Why would my Betterment portfolio have any allocation to companies outside of the U.S.?” Currently, Betterment’s Core portfolio strategy in the 100% stock allocation has a target allocation of more than 37% in international equities.
Below, this piece will cover reasons diversifying internationally makes sense, including:
- The global market portfolio is a starting point for asset allocation
- There’s no guarantee that U.S. stocks will continue to outperform
- Diversification creates the potential for more consistent returns
Investing in the global market portfolio
The short answer is that Betterment constructs all of our portfolios to be representative of the makeup of global investable assets as a whole, and you’ll find that around 36% of the world’s equity assets are invested outside of the U.S. International investments play an important role in reducing the risk of concentration in any one particular country within your portfolio.
There’s no guarantee of continued US outperformance
We’ve all heard the phrase “past performance is not indicative of future results.” For instance, stocks of one region can string together multiple years of outperformance relative to others before that trend reverses and it enters a period of underperformance. The chart below illustrates this tug of war between U.S. and international developed stocks. While the outperformance experienced by U.S. stocks over the last decade is striking, international developed stocks dominated in the wake of the dot com bubble in the decade before that.
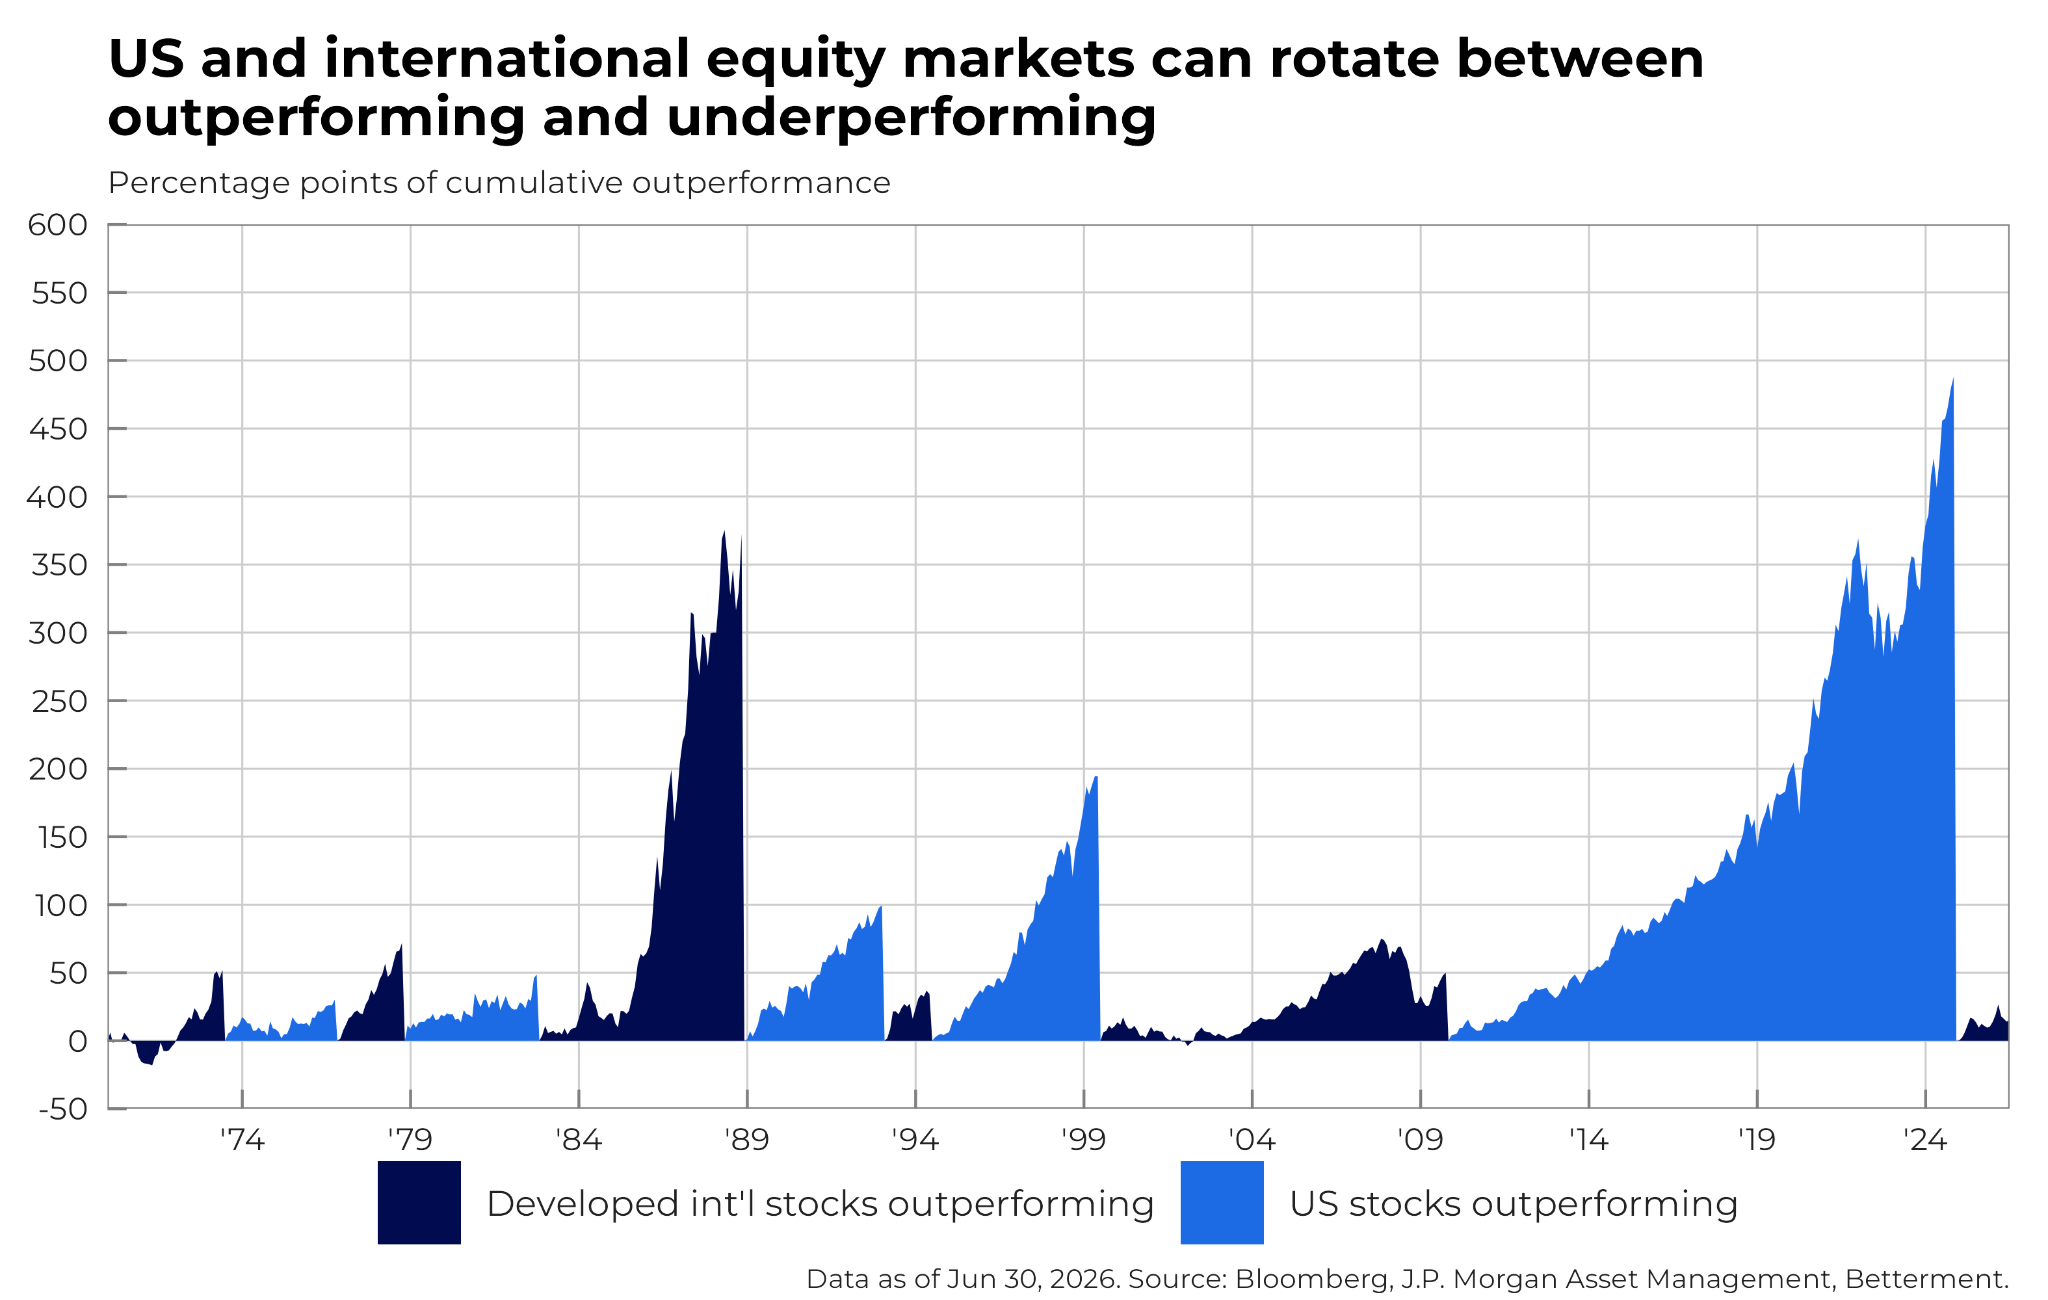
“International stocks” is represented by the MSCI EAFE Index. “US stocks” is represented by the MSCI US Index. Past performance is not indicative of future results. You cannot invest directly in the index.
Going back further into history, in the ‘80s international developed stocks actually significantly outperformed U.S. stocks. We believe, and many on Wall Street will admit, that trying to time these cycles can be extremely difficult and a more consistent return may be achieved by holding exposure to each geographical region’s stocks over the long-term.
Before U.S. stocks’ strong run in the 2010s, investors may have been tempted to allocate more to emerging market stocks based on their momentum during the 2000s. Emerging market stocks had higher returns than U.S. equities in nine of the ten years before 2011. If an investor piled into emerging market stocks in 2011 because of their decade long track record of outperformance, they would have largely missed out on the strong gains in the U.S. over the following 10 years.
There also may be reason to believe that markets outside the U.S. have the potential to post strong gains over the next decade. Based on certain valuation metrics, U.S. stocks appear more expensive than their global peers. Also, companies in places such as emerging markets source much of their revenue from quickly growing economies, which may enhance profitability in the future. For example, key firms involved in the semiconductor manufacturing process seeing exceptional demand from the rise of AI exist outside of the U.S.
Diversification helps avoid drawdowns and creates the potential for consistent returns
International markets are not perfectly correlated with the U.S., meaning they do not move in lockstep. Allocating to markets around the world therefore promotes diversification, helping buffer portfolios from the heightened volatility of individual markets.
The chart below ranks the returns of Betterment’s tenured Core portfolio strategy against different regions and asset classes across calendar years, illustrating diversification in action. A 90% stock Core portfolio consistently avoided losses compared to the poorest performing major asset classes of recent history. This was also evident in 2020 where diversification provided downside protection as the U.S. fell into a short recession at the beginning of the year and battled a pandemic.
Investors focused on using the S&P 500 Index to benchmark performance will highlight that the index outperformed our Core portfolio in many of the time periods displayed. And while the strength of the U.S. market is undeniable, it is important to not overlook the fact that our Core portfolio still has a sizable allocation to the U.S. Having a strategic, well-diversified portfolio allows investors to obtain exposure to not only markets that outperform like the U.S., but also to international stock markets and other asset classes that can dampen the downside in years where U.S. stocks underperform.
The Performance of the Betterment Core portfolio compared with major indices
|
2020 |
2021 |
2022 |
2023 |
2024 |
2025 |
YTD-2026 |
|
U.S. Stocks: 21.3% |
U.S. Stocks: 27.0% |
Int'l Dev. Stocks: -14.5% |
U.S. Stocks: 27.1% |
U.S. Stocks: 25.1% |
Int'l EM Stocks: 33.6% |
Int'l EM Stocks: 24.1% |
|
Int'l EM Stocks: 18.3% |
90% stock Core: 16.1% |
90% stock Core: -14.8% |
Int'l Dev. Stocks: 18.2% |
90% stock Core: 14.1% |
Int'l Dev. Stocks: 31.2% |
U.S. Stocks: 15.2% |
|
90% stock Core: 12.8% |
Int'l Dev. Stocks: 11.3% |
Global Bonds: -16.3% |
90% stock Core: 16.6% |
Int'l EM Stocks: 7.5% |
90% stock Core: 20.4% |
90% stock Core: 11.4% |
|
Global Bonds: 9.2% |
Int'l EM Stocks: -2.5% |
U.S. Stocks: -19.5% |
Int'l EM Stocks: 9.8% |
Int'l Dev. Stocks: 3.8% |
U.S. Stocks: 17.8% |
Int'l Dev. Stocks: 10.8% |
|
Int'l Dev. Stocks: 7.8% |
Global Bonds: -4.7% |
Int'l EM Stocks: -20.1% |
Global Bonds: 5.7% |
Global Bonds: -1.7% |
Global Bonds: 8.2% |
Global Bonds: 0.9% |
For educational purposes only. Performance information is based on returns data from Bloomberg as of June 30, 2026. Dividends are assumed to be reinvested daily at market closing prices into the fund from which the dividend was distributed. Index performance does not reflect any of Betterment’s management fees, transaction costs or fund expenses. You cannot invest directly in an index. Hypothetical performance information for the Betterment portfolio allocations is based on the time-weighted returns of Betterment portfolios with primary tickers that are at the target allocation every market day (this assumes portfolios are rebalanced daily at market closing prices). Dividends are assumed to be reinvested in the fund from which the dividend was distributed. Performance information presented reflects the impact of market conditions over the period displayed. Market conditions can and will impact performance (including economic crises, political discord, interest rates, exchange rates, and social events). Betterment allocations reflect portfolio holdings as of June 30, 2026 and are net of fund fees and are net of an annual 0.25% management fee, which is the maximum management fee charged by Betterment to Betterment at Work 401(k) plans and participants; however, individual plan fees may vary. The performance information is not net of additional fees for recordkeeping that may be charged to a plan or plan participants. Hypothetical performance information does not include deposits or withdrawals over the performance period. These portfolio allocations are not representative of the performance of any actual Betterment account and actual client experience may vary because of factors including, individual deposits and withdrawals, secondary tickers present in the portfolio through tax loss harvesting, allowed portfolio drift, rebalancing, transactions that do not occur at close of day prices, and differences in holdings between tax-advantaged and taxable portfolios. As such, it is not recommended to use model performance in making investing decisions. Investing in securities involves risks, and there is always the potential of losing money when you invest in securities. Past performance is not indicative of future results. This information is prohibited from being disseminated to any retail client or person other than the recipient. Reported performance is subject to change as funds/ data providers may revise performance.
At Betterment, we build portfolios and provide advice on portfolio allocations that should be suitable for each investor’s risk tolerance to help them reach their investment goals. Diversifying across stock markets, whether in the U.S. or elsewhere in the world, helps in that continuous effort. It may be tempting to chase the high returns that U.S. stocks have posted historically, but investors should recognize that future outperformance is near impossible to predict and that they should position themselves for a wide range of possible outcomes accordingly. This is why as a foundation of Betterment’s portfolio construction process, we start with a diversified global market portfolio.